Authors:
(1) Shadab Ahamed, University of British Columbia, Vancouver, BC, Canada, BC Cancer Research Institute, Vancouver, BC, Canada. He was also a Mitacs Accelerate Fellow (May 2022 - April 2023) with Microsoft AI for Good Lab, Redmond, WA, USA (e-mail: [email protected]);
(2) Yixi Xu, Microsoft AI for Good Lab, Redmond, WA, USA;
(3) Claire Gowdy, BC Children’s Hospital, Vancouver, BC, Canada;
(4) Joo H. O, St. Mary’s Hospital, Seoul, Republic of Korea;
(5) Ingrid Bloise, BC Cancer, Vancouver, BC, Canada;
(6) Don Wilson, BC Cancer, Vancouver, BC, Canada;
(7) Patrick Martineau, BC Cancer, Vancouver, BC, Canada;
(8) Franc¸ois Benard, BC Cancer, Vancouver, BC, Canada;
(9) Fereshteh Yousefirizi, BC Cancer Research Institute, Vancouver, BC, Canada;
(10) Rahul Dodhia, Microsoft AI for Good Lab, Redmond, WA, USA;
(11) Juan M. Lavista, Microsoft AI for Good Lab, Redmond, WA, USA;
(12) William B. Weeks, Microsoft AI for Good Lab, Redmond, WA, USA;
(13) Carlos F. Uribe, BC Cancer Research Institute, Vancouver, BC, Canada, and University of British Columbia, Vancouver, BC, Canada;
(14) Arman Rahmim, BC Cancer Research Institute, Vancouver, BC, Canada, and University of British Columbia, Vancouver, BC, Canada.
Table of Links
IV. RESULTS
A. Segmentation performance
The performance of the four networks were evaluated using median DSC, FPV and FNV and mean DSC on both internal (including performances segregated by different internal cohorts) and external test sets, as shown in Table II. Some visualization of networks performances have been illustrated in Fig. 2,
The SegResNet had the highest median DSC on both internal and external test sets with medians of 0.76 [0.27, 0.88] and 0.68 [0.40, 0.78], respectively. For the individual cohorts within the internal test set, UNet had the best DSC on both DLBCL-BCCV and PMBCL-BCCV with a median of 0.72 [0.24, 0.89] and 0.74 [0.02, 0.90], respectively, while SegResNet had the best DSC of 0.78 [0.62, 0.87] on DLBCLSMHS. SegResNet also had the best FPV on both internal and external test sets with values of 4.55 [1.35, 31.51] ml and 21.46 [6.30, 66.44] ml. Despite the UNet winning on DSC for DLBCL-BCCV and PMBCL-BCCV sets, SegResNet had the best FPV on both these sets with median values of 5.78 [0.61, 19.97] ml and 2.15 [0.52, 7.18] ml, respectively, while UNet had the best FPV of 8.71 [1.19, 34.1] ml on DLBCLSMHS. Finally, SwinUNETR had the best median FNV of 0.0 [0.0, 4.65] ml on the internal test set, while UNet had the best median FNV of 0.41 [0.0, 3.88] ml on the external test set. On DLBCL-BCCV and DLBCL-SMHS, SwinUNETR had the best median FNV of 0.09 [0.0, 3.39] ml and 0.0 [0.0, 8.83] ml, respectively, while on PMBCL-BCCV, UNet, DynUNet, and SwinUNETR were tied, each with a median value of 0.0 [0.0, 1.24] ml.
Firstly, both SegResNet and UNet generalized well on the unseen external test set, with a drop in mean & median
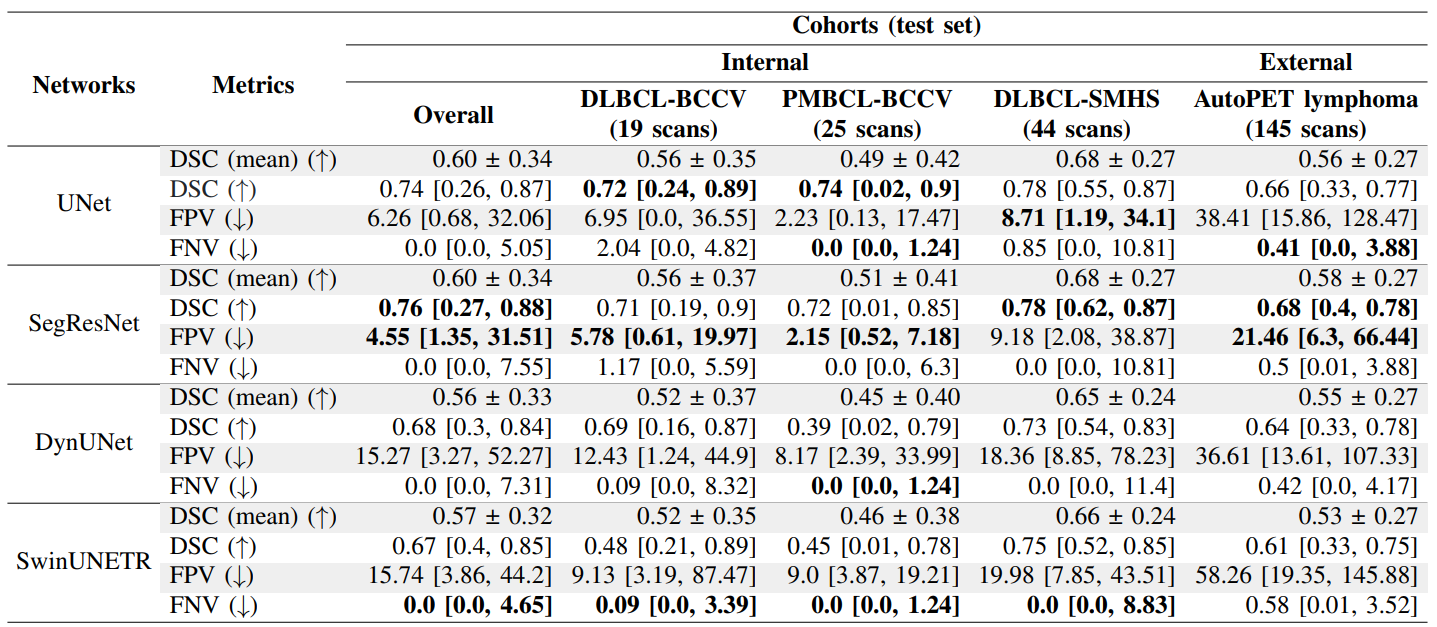
performance by 4% & 8% and 2% & 8%, respectively as compared to the internal test set. Although the median DSC of DynUNet and SwinUNETR are considerably lower than SegResNet and UNet on the internal test set (by about 6-9%), these networks had even better generalizations with a drop in median DSC of only 4% and 6%, respectively, when going from internal to external testing. It is also worth noting that the DSC IQRs for all networks were larger on the internal test set as compared to the external test set. Also, all networks obtained a higher 75th quantile DSC on the internal test set as compared to the external test set, while obtaining a lower 25th quantile DSC on the internal test as compared to the external test set (except for SwinUNETR where this trend was reversed). Similarly, for different cohorts within the internal test set, all networks had the highest median and 25th quantile DSC on DLBCL-SMHS set. The worst performance was obtained on the PMBCL-BCCV cohort with the largest IQR across all networks (see Section IV-A.2 and Fig. 6). Interestingly, despite having a lower performance on DSC on both internal and external test sets (as compared to the best performing models), SwinUNETR had the best median FNV values across cohorts in the internal test set.
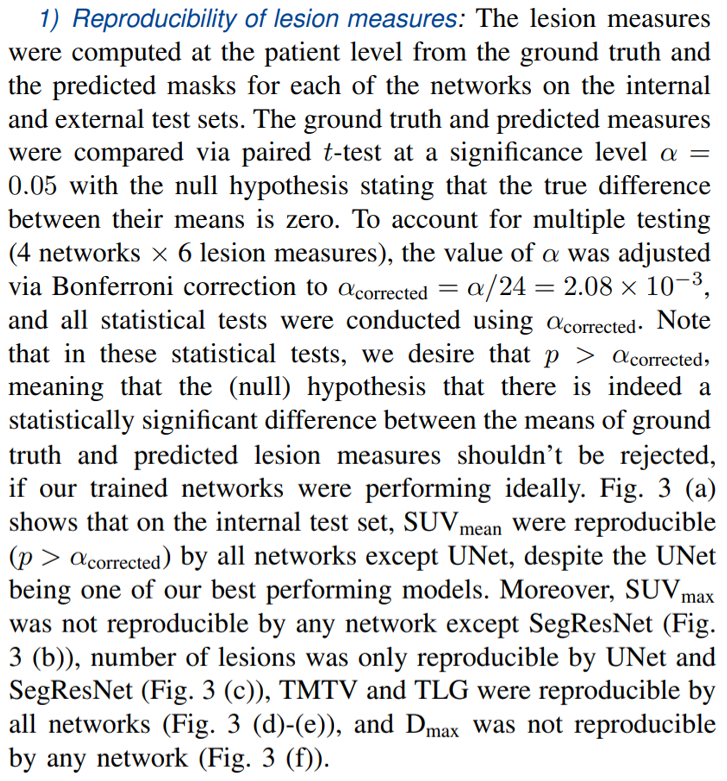
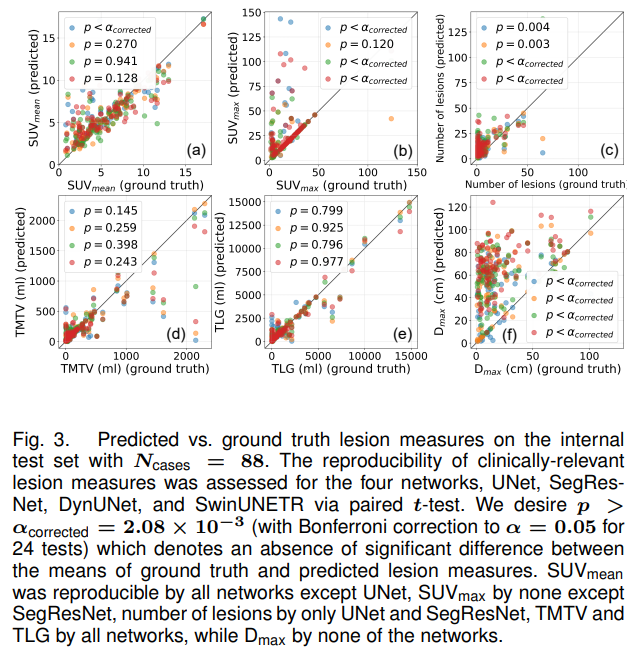
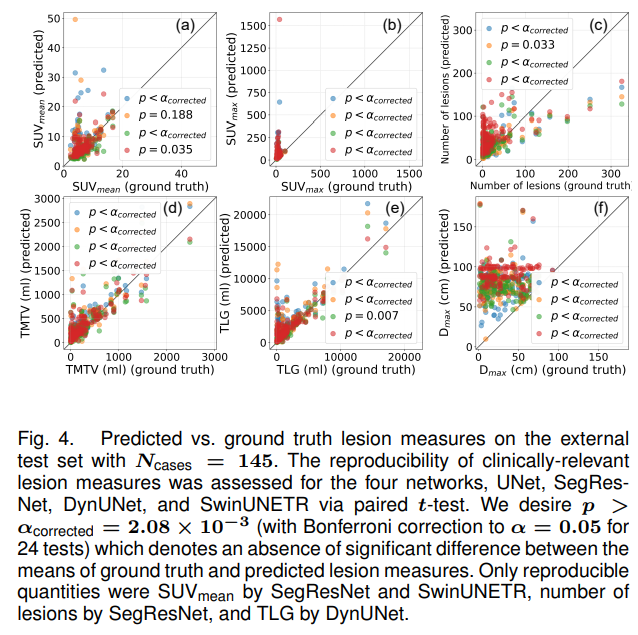
Same analysis was carried out on the external test set, as shown in Fig. 4. For the external test set, the only lesion measures that were reproducible were SUVmean by SegResNet and SwinUNETR, number of lesions by SegResNet, and TLG by DynUNet. This shows that the performance of networks in terms of DSC or other traditional segmentation metrics don’t always reflect their adeptness at estimating lesion measures. Lesion measures such as SUVmax, number of lesions and Dmax are usually hard to reproduce by the networks. SUVmax was highly sensitive to incorrect false positive predictions in regions of high SUV uptake. Similarly, the number of lesions were highly sensitive to incorrectly segmented disconnected components, and Dmax was highly sensitive to the presence of a false positive prediction far away from the ground truth segmentations (even though the volumes of such false positive predictions could be very small, in which case it would contribute very little to TMTV or TLG, as seen on the internal test set).
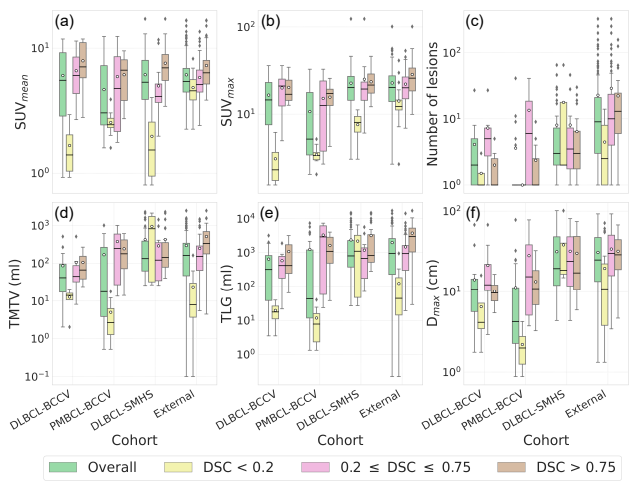
2) Effect of ground truth lesion measures values on network performance: First, we computed ground truth lesion measures for the internal and external test sets, and looked at the performance of UNet (based on DSC) for each of these measures and different datasets, as presented in Fig. 6. The performance was segregated into four different categories, namely (i) overall test set, (ii) cases with DSC < 0.2, (iii) cases with 0.2 ≤ DSC ≤ 0.75, and (iv) cases with DSC > 0.75 in the test set. From Fig. 6 (a)-(b), it is evident that for the categories with higher DSCs, the values of (mean and median) patient level SUVmean and SUVmean were also higher for internal cohort as well as the external cohort test sets. The lower overall performance on the PMBCL-BCCV set can also be attributed to lower overall mean and median SUVmean and SUVmean. A similar trend was observed for number of lesion (Fig. 6 (c)) only on the external test set, but not on any of the internal test cohorts. Note that the mean number of lesions on the external test set was considerably higher than any of the internal test sets. For TMTV and TLG, all the cohorts with higher DSCs also had higher mean and median TMTVs or TLGs, except on the DLBCL-SMHS cohort, where the category DSC < 0.2 had the highest mean and median TMTV and TLG. This anomaly can be attributed to the fact that despite being large, the lesions for cases in this category for this cohort were faint, as shown in Fig. 6 (a)-(b). Finally, for Dmax, the category 0.2 ≤ DSC ≤ 0.75 had the highest median Dmax on all cohorts and highest mean Dmax on all cohorts except on DLBCL-SMHS. Lower values of Dmax signify lower spread of the disease, which can either correspond to cases with just one small lesion, or several (small or large) lesions located nearby.
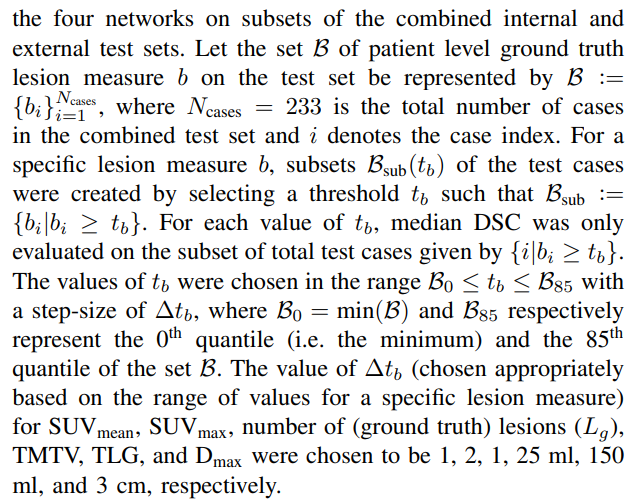
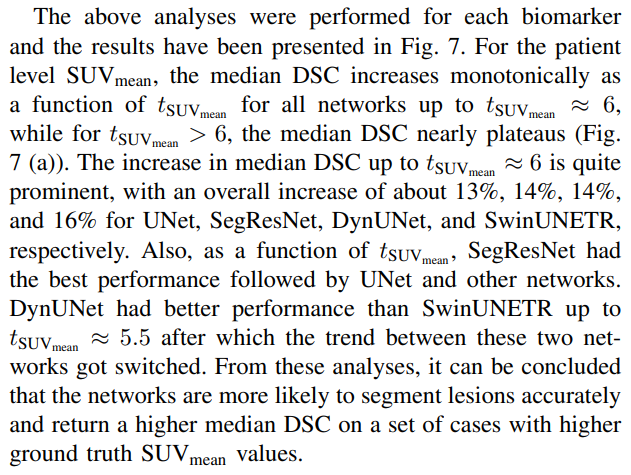
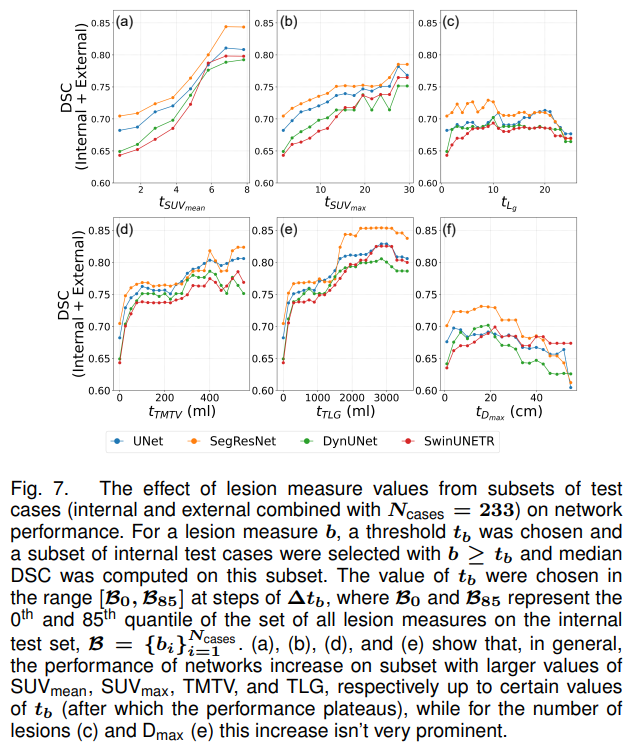
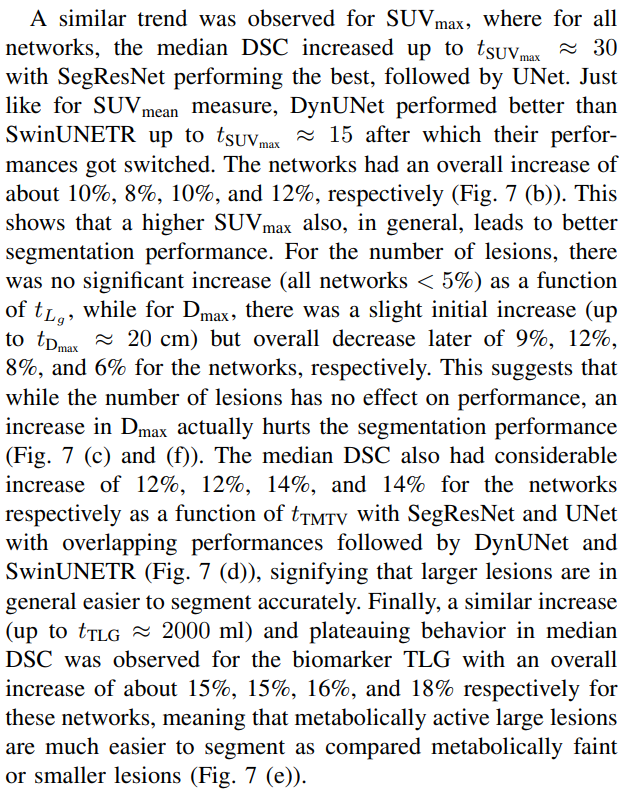
Secondly, we evaluated the performance (median DSC) of
B. Detection performance
We evaluated the performance of our networks on three types of detection metrics, as defined in Section III-D.2. Criterion 1, being the weakest detection criterion, had the best overall detection sensitivity of all criteria across all networks on both internal and external test sets, followed by Criterion 3 and then Criterion 2 (Fig. 8). From Criterion 1, UNet, SegResNet, DynUNet, and SwinUNETR obtained median sensitivities of 1.0 [0.57, 1.0], 1.0 [0.59, 1.0], 1.0 [0.63, 1.0], and 1.0 [0.66, 1.0] respectively on the internal test set, while on the external set, they obtained 0.67 [0.5, 1.0], 0.68 [0.51, 0.89], 0.70 [0.5, 1.0], and 0.67 [0.5, 0.86] respectively. Naturally, there was a drop in performance upon going from the internal to external testing. Furthermore, Criterion 1 had the best performance on the number of FP metrics with the networks obtaining 4.0 [1.0, 6.0], 3.0 [2.0, 6.0], 5.0 [2.0, 10.0], and 7.0 [3.0, 11.25] median FPs respectively on the internal test set, and 16.0 [9.0, 24.0], 10.0 [7.0, 19.0], 18.0 [10.0, 29.0], and 31.0 [21.0, 55.0] median FPs respectively on the external test set.
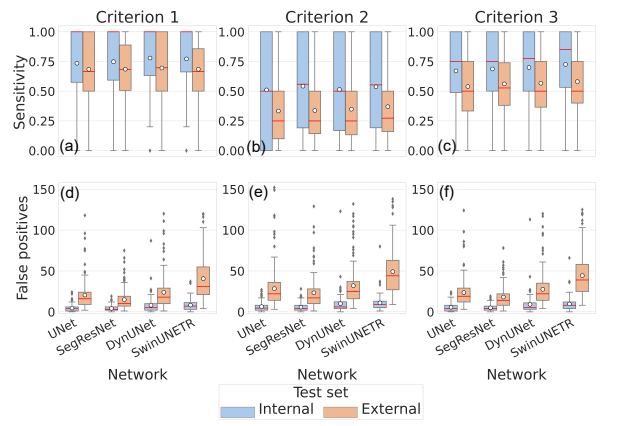
Furthermore, being a harder detection criterion, Criterion 2 had the lowest detection sensitivities for all networks with median being 0.5 [0.0, 1.0], 0.56 [0.19, 1.0], 0.5 [0.17, 1.0], and 0.55 [0.19, 1.0] respectively on the internal test set, and 0.25 [0.1, 0.5], 0.25 [0.14, 0.5], 0.25 [0.13, 0.5], and 0.27 [0.16, 0.5] respectively on the external test set. For this criterion, the drop in median sensitivities on going from the internal to external test set is comparable to those of Criterion 1. Similarly, for this criterion, the median FPs per patient were 4.5 [2.0, 8.0], 4.0 [2.0, 8.0], 6.0 [4.0, 12.25], and 9.0 [5.0, 13.0] respectively on the internal test set, and 22.0 [14.0, 36.0], 17.0 [10.0, 28.0], 25.0 [16.0, 37.0], and 44.0 [27.0, 63.0] respectively on the external test set. Despite the sensitivities being lower than in Criterion 1, the FPs per patient is similar on both internal and external test sets for Criterion 2 (although the variation of median FPs between criteria on the external test set for SwinUNETR is the highest).
Finally, the Criterion 3, based on the detection of the SUVmax voxel of the lesions, was an intermediate criterion between Criteria 1 and 2, since the model’s ability to detect lesions accurately increases with the lesion SUVmax (Section IV-A.2). For this criteria, the networks had median sensitivities of 0.75 [0.49, 1.0], 0.75 [0.5, 1.0], 0.78 [0.5, 1.0], and 0.85 [0.53, 1.0] respectively on the internal test set, and 0.5 [0.33, 0.75], 0.53 [0.38, 0.74], 0.5 [0.37, 0.75], and 0.5 [0.4, 0.75] respectively on the external test set. The drop in sensitivities between internal and external test sets is comparable to the other two criteria. Similarly, the networks had median FP per patient of 4.0 [1.0, 8.0], 4.0 [2.0, 7.0], 5.0 [3.0, 11.0], and 8.0 [4.0, 12.0] respectively on the internal test set, and 19.0 [12.0, 29.0], 14.0 [8.0, 22.0], 22.0 [14.0, 35.0], and 39.0 [25.0, 58.0] respectively on the external test set.
C. Intra-observer variability
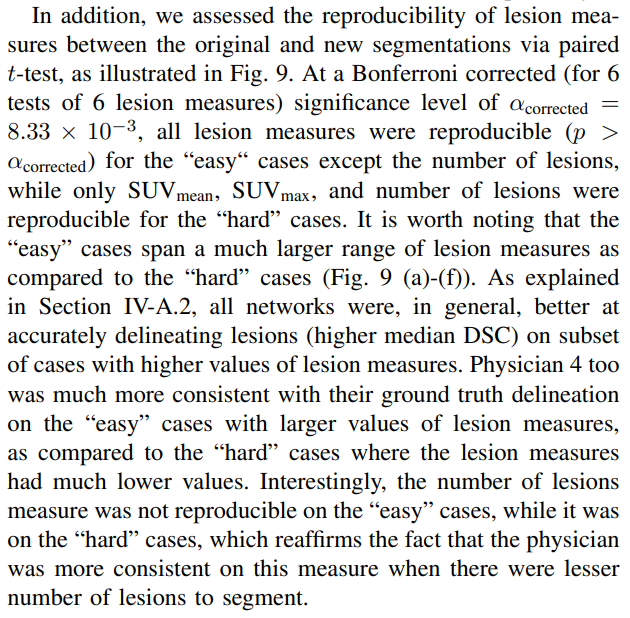
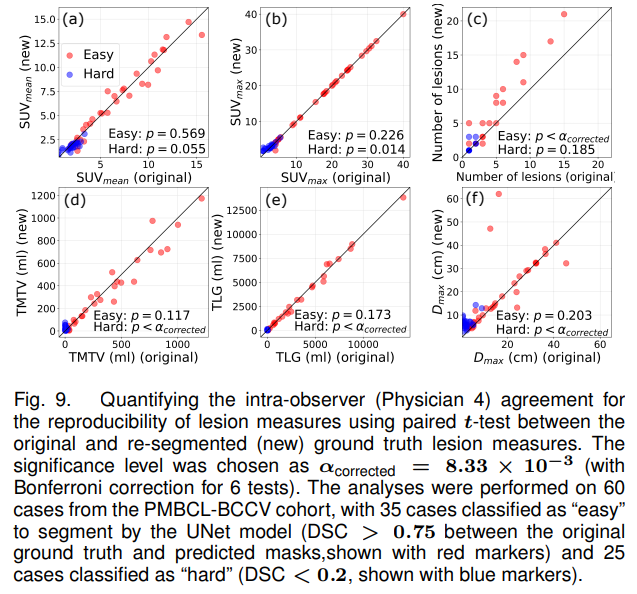
To perform intra-observer variability analysis, 60 cases from the entire PMBCL-BCCV cohort (encompassing train, valid, and test sets) were re-segmented by Physician 4. This subset comprised of 35 “easy” cases (cases with UNet predicted masks obtaining DSC > 0.75 with the original ground truth) and 25 “hard” cases (DSC < 0.2). To eliminate bias, the selection of these cases, except for the DSC criteria, was randomized, ensuring no preference in the selection of specific cases were given during the re-segmentation process.
The overall mean and median DSC between physician’s original and new segmentations over the “easy” and “hard” cases combined was 0.50 ± 0.33 and 0.49 [0.20, 0.84]. Here, the mean was comparable to the PMBCL-BCCV test set performance (0.49 ± 0.42) of UNet, although the median was much lower than that of UNet (0.74 [0.02, 0.9]). The “hard” cases exhibited lower reproducibility in generating consistent ground truth, as indicated by the mean and median DSCs between the original and re-segmented annotations, which were found to be 0.22±0.18 and 0.20 [0.05, 0.36] respectively. Conversely, for the “easy” cases, the mean and median DSC values were 0.70 ± 0.26 and 0.82 [0.65, 0.87] respectively.
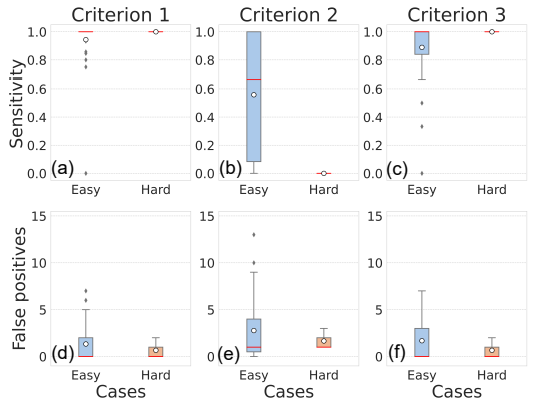
Finally, we also performed detection analysis on the original and new segmentation, as illustrated in Fig. 10. For this analysis, we treated the original segmentation as ground truth and the new segmentation as predicted masks. For Criterion 1, the median detection sensitivities on both the “easy” and “hard” cases were 1.0 [1.0, 1.0], stating that the physician always segmented at least one voxel consistently between the original and new annotations. This criterion had median FPs per patient of 0.0 [0.0, 2.0] and 0.0 [0.0, 0.0] on the “easy” and “hard” cases respectively, stating that for the “hard” cases, the physician never segmented any lesion in an entirely different location as compared to their original masks. For Criterion 2, the sensitivities were 0.67 [0.08, 1.0] and 0.0 [0.0, 0.0] on the “easy” and “hard” cases respectively. This means that for the new annotation on the “hard” cases, the physician never segmented any lesion which had an IoU > 0.5 with any lesions from the original annotation. For this criterion, the median FPs per patient were 1.0 [0.5, 4.0], and 1.0 [1.0, 1.0] for the “easy” and “hard” cases respectively. Finally, for Criterion 3, the sensitivities were 1.0 [0.84, 1.0] and 1.0 [0.5, 1.0], while the FPs per patient were 0.0 [0.0, 3.0] and 0.0 [0.0, 1.0] for the “easy” and “hard” cases respectively. It is worth noting that trend between the physician’s detection performance as assessed by these three criteria is similar to that by the four networks in Section IV-B (Criterion 1 > Criterion 3 > Criterion 2).
D. Inter-observer variability
Nine cases (all belonging to different patients) were randomly selected from the DLBCL-BCCV set which were segmented by two additional physicians (Physicians 2 and 3). The mean Fleiss κ coefficient over these 9 cases was 0.72, which falls in the category of “substantial” agreement between the physicians. This level of agreement underscores the reliability and consistency of the ground truth segmentation obtained from multiple annotators.
Secondly, we computed the pair-wise DSC between every two physicians for all 9 cases. The mean DSCs between Physicians 1 & 2, 2 & 3, and 1 & 3 were 0.67 ± 0.37, 0.83 ± 0.20, and 0.66 ± 0.37. Moreover, the STAPLE [24] consensus for the three physicians were generated for all the 9 cases and DSCs between the STAPLE and ground truth segmentations were calculated for each physician. The mean DSCs with the STAPLE ground truth for Physicians 1, 2, and 3 were 0.75±0.37, 0.91±0.11, and 0.90±0.16, respectively.
This paper is

