

This is Part 10 of a 11-part series based on the research paper “Reinforcement Learning In Agent-based Market Simulation: Unveiling Realistic Stylized Facts And Behavior”. Use the table of links below to navigate to the next part.
Table of Links
Part 1: Abstract & Introduction
Part 4: Agents & Simulation Details
Part 8: Market and Agent Responsiveness to External Events
Part 9: Conclusion & References
Part 10: Additional Simulation Results
Part 11: Simulation Configuration
7 Appendix
7.1 Additional Simulation Results
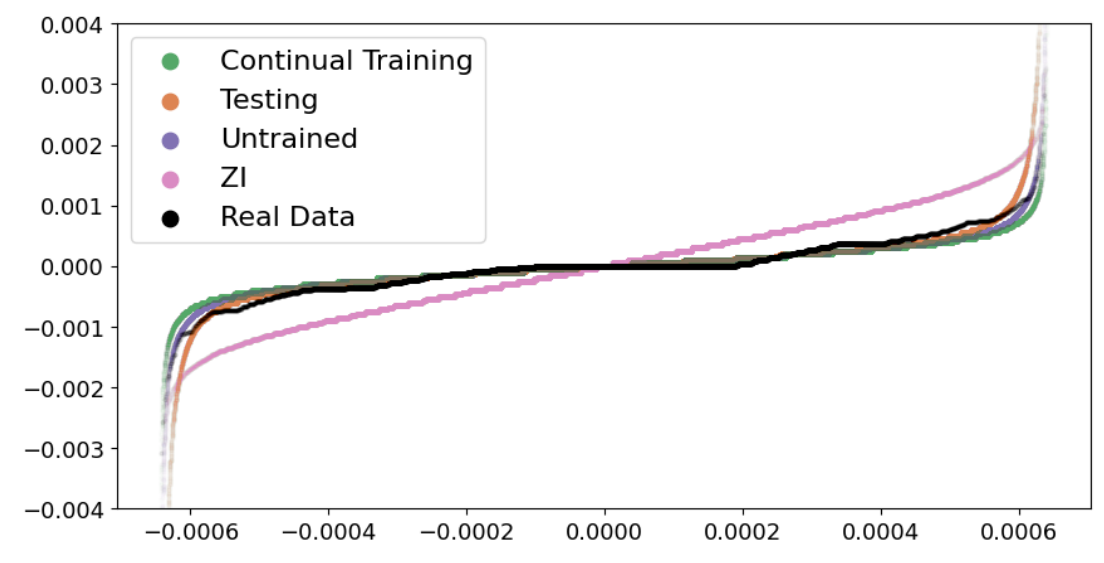
Figure 1 is the QQ plot for simulations’ prices(10 seconds) generated with all five groups of setup, providing additional insights to Figure 3a. More details in section 5.1.
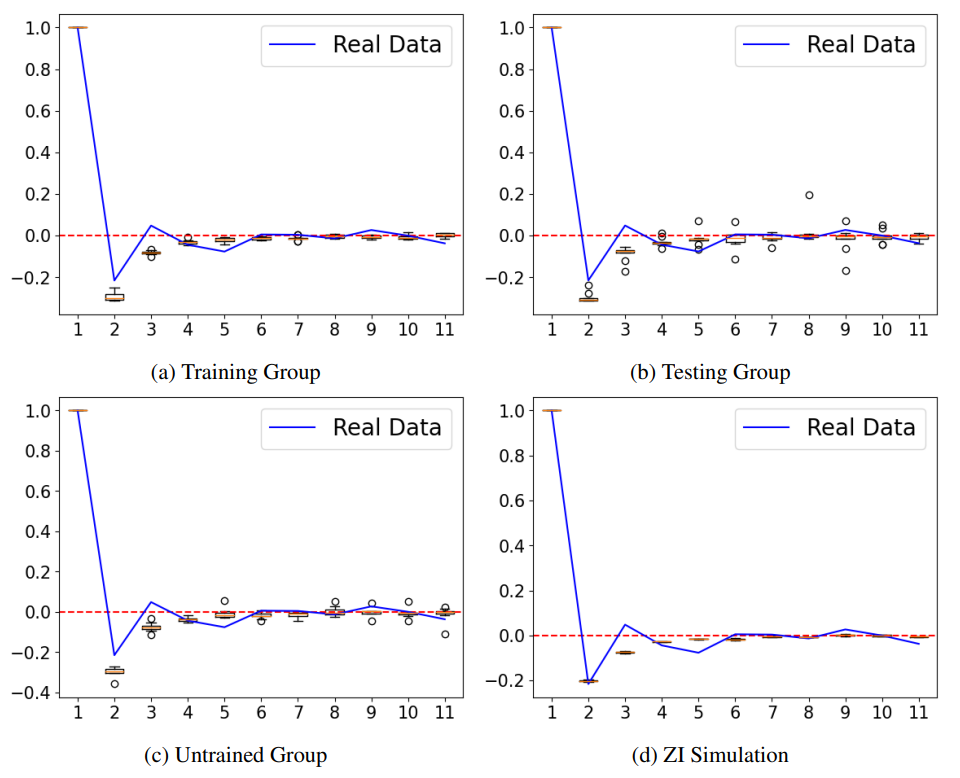
Figure 2 shows the ACF graphs for the price returns from groups of testing and untrained. More details in section 5.1.
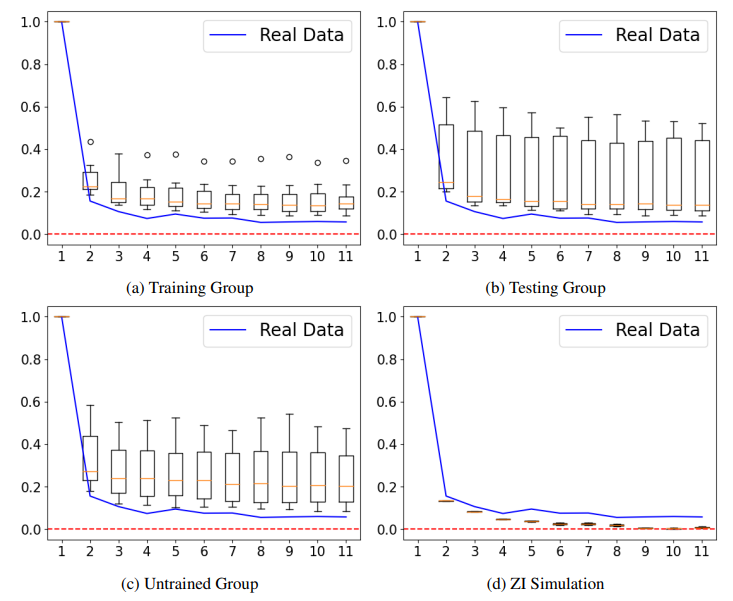
Figure 3 shows the ACF graphs for the absolute price returns from groups of testing and untrained. More details in section 5.1.
Figure 4 shows the volatility clustering analysis graphs for groups of testing and untrained. The analysis method can be found in [1]. More details in section 5.1.
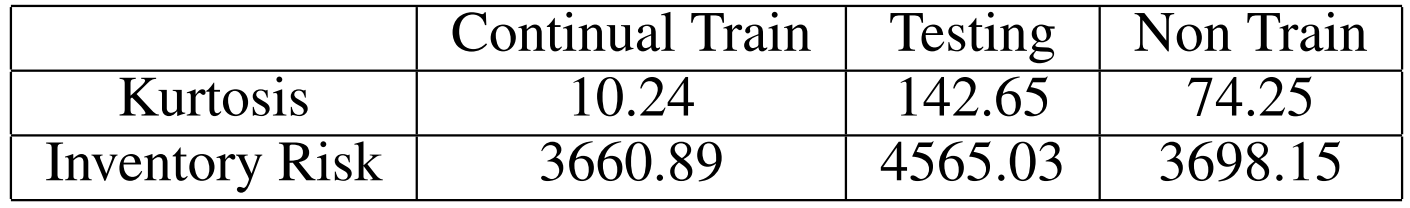
Table 1 provides additional market characteristics (Kurtosis and Inventory Risk) for groups of continual train, testing, and non train.
Authors:
(1) Zhiyuan Yao, Stevens Institute of Technology, Hoboken, New Jersey, USA ([email protected]);
(2) Zheng Li, Stevens Institute of Technology, Hoboken, New Jersey, USA ([email protected]);
(3) Matthew Thomas, Stevens Institute of Technology, Hoboken, New Jersey, USA ([email protected]);
(4) Ionut Florescu, Stevens Institute of Technology, Hoboken, New Jersey, USA ([email protected]).
This paper is available on arxiv under CC BY-NC-SA 4.0 DEED license.